

.webp)

Is your business worth investing in? For most of you, the answer is a definitive 'Yes.' But in the business world, talk is cheap. So if you want to attract investors, you'll need to be able to walk the talk, i.e., put your money where your mouth is.
There's no better way to do that than with a financial analysis report. After all, numbers don't lie. They're the smoking gun investors need before investing in your business.
Want to learn how to write a financial analysis report that attracts investors? This article covers six simple steps to follow. But first:
What Is A Financial Analysis Report?
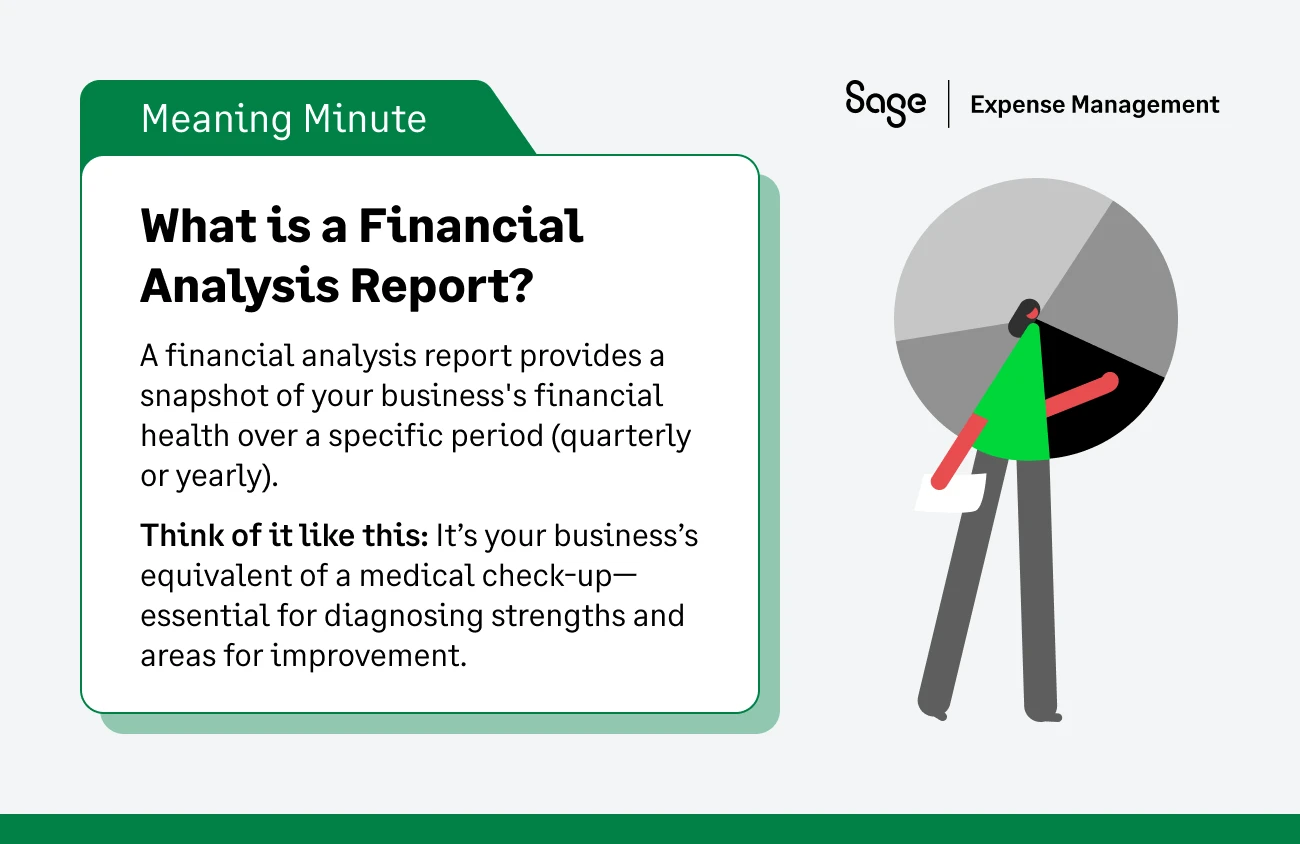
A financial analysis report shows the financial performance of your business over a specified period of time, usually on a quarterly or yearly basis. It's like a medical report but for your business's financial health.
In several countries, financial reporting is a requirement. The Securities and Exchange Commission requires companies to disseminate these reports to their shareholders in the United States. In addition, these financial reports are usually made available to the public if they're publicly-listed companies.
A financial analysis report is invaluable to both you and your stakeholders. Let's discuss why you need it in the next section.
How Does A Financial Analysis Report Help?
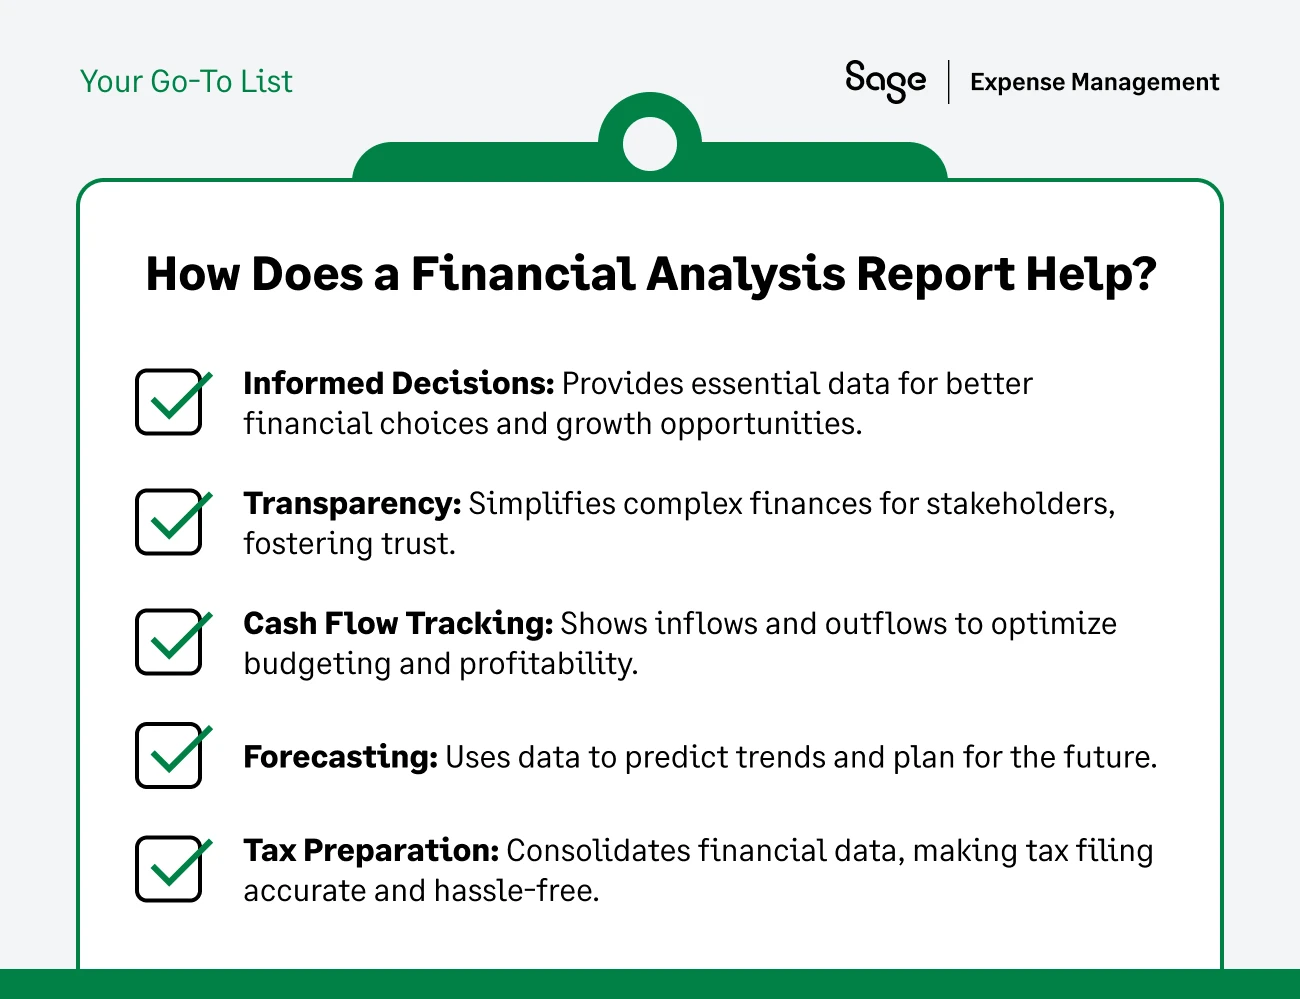
To make the right financial decisions for your business, you need data. This helps you lay a solid foundation for future performance and economic growth opportunities.
However, you need to be able to keep track of and make sense of all your financial data. That's where a financial analysis report comes in. It helps you organize, analyze, and paint a clearer picture of your business's cash flow and allows for seamless management of business expenses too.
Aside from those, here are a couple of more reasons why you need a financial analysis report:
Ensures Transparency
A financial analysis report is easy on the eyes. It's a watered-down version of your finances that communicates essential data you need to make financial decisions.
You ensure the transparency your stakeholders want, too.
Tracks Cash Flow
Generally, financial reports help you understand cash inflows and outflows. For example, if you know your affiliate sales and operating expenses, the cost of getting links to increase website traffic, social media marketing campaign expenditure, and the money coming in, you can make better financial decisions.

The information can help with debt ratios, budgeting, debt-to-asset financial ratio analysis, and calculating profit margins.
Allows For Data-Driven Forecasting
Historical and real-time financial data help create financial models to predict future financial performance. These reports help you identify trends, patterns, and problems. As a result, you can plan for them early enough.
Simplifies Taxation
To create a financial analysis report, you must have all your data in a single document. It becomes easier for you to do your taxes, saves you time, and reduces the chances of making errors. Moreover, it's an official document that the Internal Revenue Service can use to calculate your taxes.
At the end of the day, the goal of a financial report is to provide insight into your organization's finances. Then, using both historical and current data, you can set SMART business goals to make better decisions for future performance.
Also Read
Benefits Of A Periodic Financial Analysis
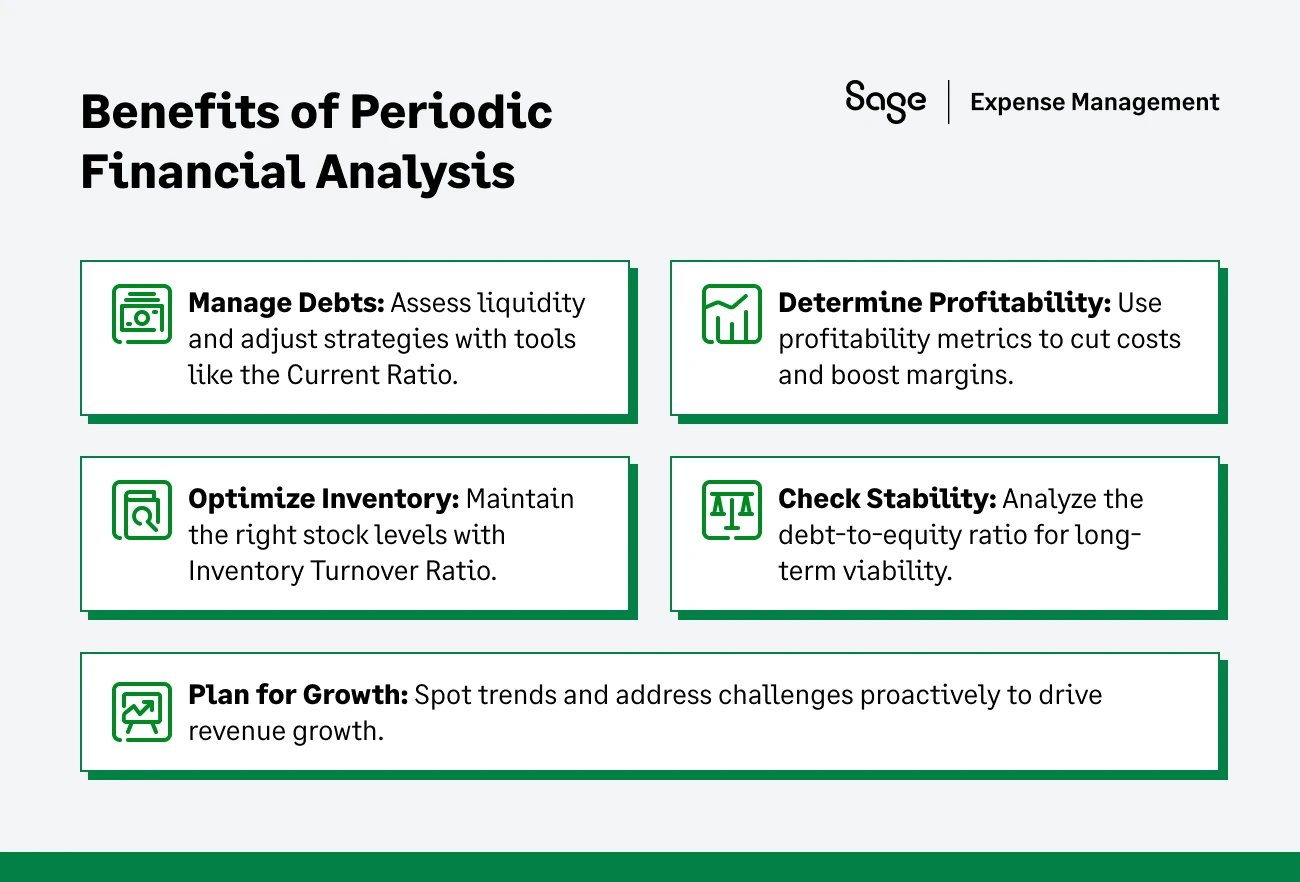
Financial analysis makes it easy for you to identify the strengths and weaknesses of your business. Using that information will not only help your business grow but also thrive. What's more, doing financial analysis over specific periods helps you stay on top of your game by:
Helping Manage Debts
A periodic financial analysis includes a financial ratio analysis; specifically, a Liquidity Ratio called the Current Ratio Analysis. The Current Ratio is the sum of all your current assets divided by the sum of your current liabilities. It shows if you're liquid enough to meet your upcoming debts. So, if you aren't, you can adjust your financial strategy the soonest.
Determining Profitability
When you perform a periodic financial analysis, you can determine your company's profitability and make regular adjustments. A profitability ratio is a financial metric that can help you cut production costs and boost your bottom line.
You can use a profitability ratio (featured below) to determine your profit margin on sales, i.e., your gross profit margin. Here's the formula.
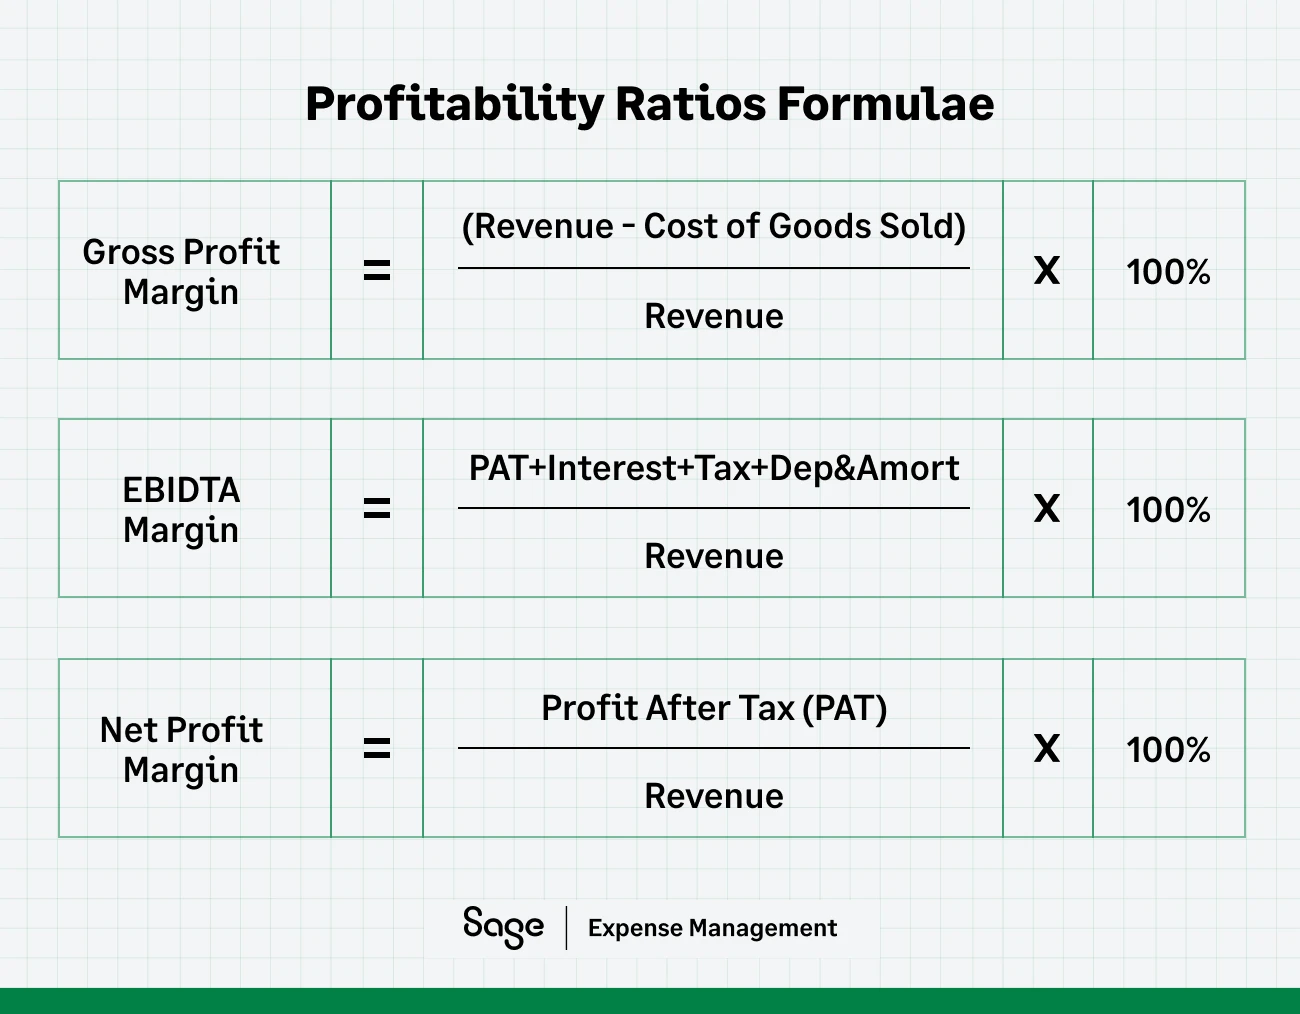
It's your sales revenue minus the total cost of goods sold (COGS) divided by revenue.
Managing Inventory
Another perk of doing financial analysis over a specific period is that it helps you better manage inventory. This way, you ensure it's always enough to meet projected sales. You do this using a financial management ratio called the Inventory Turnover Ratio.
Calculate the Turnover Ratio by dividing your total sale by your inventory.
Checking Stability And Revenue Growth
The results of a periodic financial analysis yield your debt-to-equity ratio, too. It's a financial metric that shows how you've raised capital for your business. You want to check your stability and revenue growth every step of the way to determine whether your business is viable in the long run.
The debt-equity ratio is calculated by dividing your total liabilities by your shareholder's equity. It's usually included when you write a financial analysis report.
Generally speaking, the higher your debt-equity ratio, the higher the risk, and vice versa. Investors use this financial metric to check your company's stability and ability to raise money to grow.
Optimizing For Growth
Financial analysis over specific periods helps you identify opportunities to optimize operational efficiency for revenue growth. That is, regular annual reports help you spot patterns and trends. This allows you to nip problematic areas in the bud and prepare in advance.
For instance, you can adjust seasonal sales fluctuations, variable costs, etc.
How To Write A Financial Analysis Report
Now that you understand a financial analysis report's 'what' and 'why,' it's time to look at the 'how.'
Here's how to write a financial analysis report:
1. Give An Overview Of The Company
The first section of your financial analysis report is the company overview. Here, you want to highlight the potential of your business. It's pretty much what you do in a business plan. Investors rely on your company overview to understand your competitive edge.
The question you want to answer here is - is your business worth the investment you're asking for? Think of the introductions in business plans or on Shark Tank to give you a better idea. As a general rule of thumb, you want to use plain language when writing your description.
You want to share, in brief, your history, business model, type of organization, description, etc. You can share what sector you're in as well as the size and scale of your business.
Featured below is an excellent example of a fictional company's overview.

Start by reviewing your quarterly or yearly financing activities, financial data, and statements. Then go through published business studies and industry-specific trade journals.
You should consider adding a snippet about how you compare to the industry average among your competitors. Like a business plan, you want to show potential investors why they should choose you. You can use Porter's Five Forces model to analyze your competition.
2. Write Sales Forecast And Other Vital Sections
It pays to be as precise and comprehensive as possible when writing the main content. So, you’ll need to organize your data and, sometimes, make some calculations yourself. For instance, when writing your sales forecast, you need your sales data for the past three years before you organize it in financial reporting software or spreadsheets. Tally the data on a yearly, monthly (for the 1st year), and quarterly (for the last two years) basis.
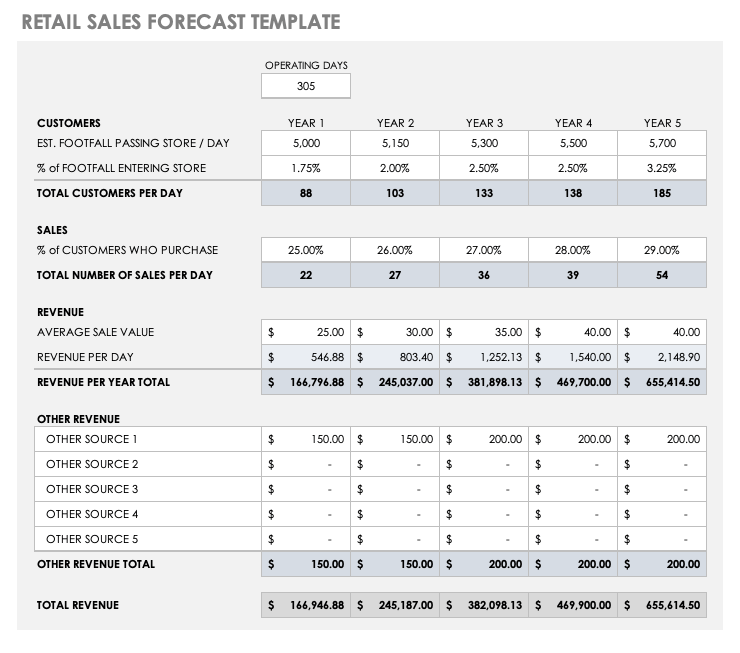
You can write this part using a spreadsheet. But feel free to use financial reporting software if spreadsheets aren’t your cup of tea.
There are other sections you should create for your report’s main body.
Let’s look at them one by one:
Expense Budget
With your sales forecast in place, it's time to figure out how much it'll cost. When setting up your expense budget, ensure it includes variable costs like your marketing budget and fixed costs like rent. In addition, you'll need to create an estimate for items like interest and taxes.
Cash Flow Statement
A cash flow statement summarizes all the money or its equal coming in (cash inflow) or leaving (cash outflow) a business. To create one, you need historical financial data or project it one year ahead if you're starting. Don't forget your cash flow statement is connected to your invoice.
Estimate For Net Profit
Tally your net profit using your sales forecast, expense budget, and cash flow statement data. Your net profit margin is your gross margin less taxes, interest, and expenses. Try and be as precise as possible since this can stand in as your profit and loss (P&L) statement.
Estimate For Assets And Liabilities
Your next step is to calculate your company's net worth. How? By managing your assets and liabilities, i.e., those items that don't appear in your P&L statement.
To do that, ballpark your monthly cash on hand. That is, equipment, inventory, land, and accounts receivable. Then sum up your liabilities, i.e., outstanding loan debts and accounts payable.
Break-Even Point
The last step in writing a company financial analysis report is calculating your break-even point. That's where your business expenses match your sales volume. Use the formula below to find your three-year sales forecast; this will help you find your break-even point.
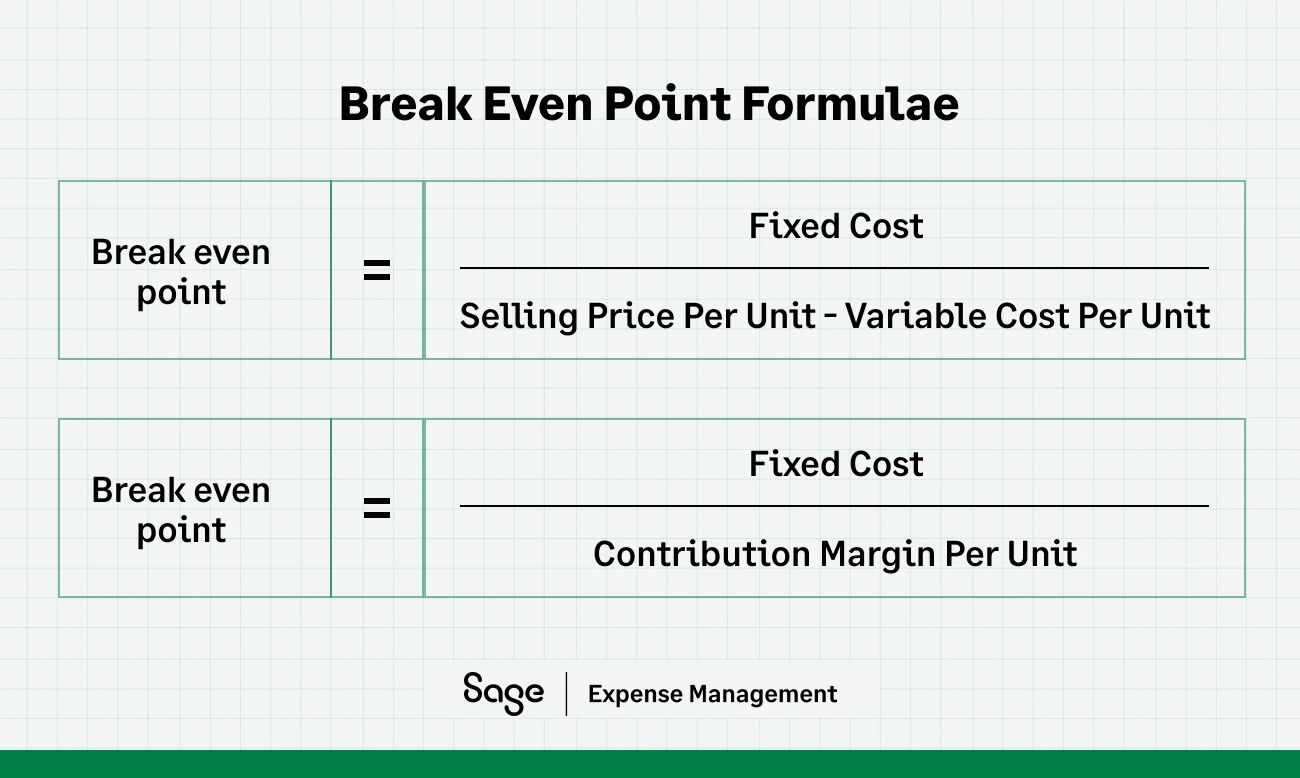
Needless to say, if you're operating a profitable business model, then your company's revenue should be higher than your operating expenses. Again, this information helps reassure potential investors of your business' stability and revenue growth potential.
Refrain from assuming that people know the concepts you'll discuss in your report. Instead, define them in general terms first before you start talking about specifics.
3. Determine The Company's Valuation
The company valuation part is one of the most critical sections of your financial analysis report. Why? Because it helps potential investors see the value of investing in your company.
To determine your business' valuation is to find your company's value. You do this by analyzing your company data, including all the data you have discussed. There are three main ways to do it, i.e., using the following:
The goal here is to outline your current assets and liabilities. Moreover, the above techniques help you determine your business' stocks and current value. To do this, most accountants or financial officers use insights from and final average accounts of your balance sheet.
4. Perform Risk Analysis
Risk analysis helps potential investors see your company's investment potential. That includes both current and future risks. You can start risk analysis by running a SWOT analysis.
But remember that your SWOT analysis is microscopic. So for the best results in your valuation, combine it with other techniques. For example, doing a PESTLE analysis. Here's a template you can use for that:

A PESTLE analysis gives you more details and offers two main benefits. First, it helps you understand your marketing environment and other macro factors that affect your company's financials.
5. Include Summaries Of Financial Statements
When writing the financial analysis report of a company, you need to include a brief overview of your company's financial statements. To do this, summarize each component of the 3-statement model:

Let's discuss each of them:
Cash flow statement. Potential investors look at your cash flow statement summary for two reasons. One, it lets them see if you make enough money to settle your debts. Two, it helps them decide whether your company is worth investing in.
Income statement. A summary of this does two things. First, it shows you gaps in increasing operating profit by allowing you to boost sales revenue, reduce cost, or both. It's also an income statement showing how effective your strategies are at the start of your financial year.
Balance sheet. The balance sheet shows your debt coverage and asset liquidity in real time. The difference between assets and liabilities gives you the 'owner's equity.' Here's an example of a balance sheet:

Note that summarizing each of these three components doesn't mean just including tables in your report. Instead, explain what the data means in paragraph form, too.
6. Summarize The Entire Report
The last section of the financial analysis report of a company is a summary. You want to share your final views about the company and your opinion on whether it's a profit or loss. That said, be sure to substantiate all your claims.
That means having evidence containing factual data, financial accounts, and proven financial theories. You can also include the outlook of the company. That is the type of organization, industry trends, economic growth strategies, and how they'll affect the company.
Common Mistakes to Avoid When Writing a Financial Analysis Report
Even with a clear roadmap, writing a financial analysis report can be challenging. Here are some common pitfalls to watch out for–and how to avoid them:
1. Overloading the Report with Unnecessary Details
While it’s essential to include all relevant financial data, overloading the report with excessive details can overwhelm readers. Focus on key metrics and insights that align with the report’s objective.
For example, instead of listing every minor transaction, group similar data into categories and provide a summary.
2. Ignoring Data Validation
Using inaccurate or incomplete data is one of the biggest mistakes in financial reporting. Always cross-check data from multiple sources and ensure consistency between the income statement, balance sheet, and cash flow statement. A single discrepancy can undermine the report’s credibility.
3. Failing to Provide Actionable Recommendations
A financial analysis report should go beyond presenting numbers. Provide actionable insights based on your findings. For instance, if the report highlights a cash flow issue, suggest strategies such as renegotiating payment terms with vendors or adjusting inventory levels.
4. Lack of Visual Aids
Charts, graphs, and tables are powerful tools for simplifying complex financial data. Failing to include these can make your report less engaging and harder to understand. Use visuals to highlight trends, compare metrics, or break down financial ratios.
5. Skipping an Executive Summary
The executive summary is crucial for engaging staeholders who may not have time to read the entire report. A concise summary should include the report’s purpose, key findings, and recommendations, giving readers a quick overview.
6. Neglecting to Tailor the Report to the Audience
Different stakeholders—investors, board members, or department heads—may prioritize different aspects of the financial report. Customize your content and language to address the concerns of your primary audience.
How Sage Expense Management (formerly Fyle) Can Help
Creating a comprehensive financial analysis report requires meticulous data tracking, organization, and analysis. Sage Expense Management’s advanced expense management software can simplify and enhance this process in the following ways:
1. Real-Time Purchase Alerts on Credit Cards

Sage Expense Management's real-time credit card feeds integrate directly with your business credit cards to give you real-time text notifications for all credit card transactions.
Users can reply to this text message with a picture of the receipt and we will automatically match it to the corresponding transaction!
2. Streamlined Receipt Management
With Sage Expense Management, employees can submit receipts instantly via SMS, email, or everyday tools like Slack and Outlook. This reduces the time spent chasing receipts and ensures that all expense data is captured accurately, contributing to the reliability of financial reports.
3. AI-Powered Spend Insights
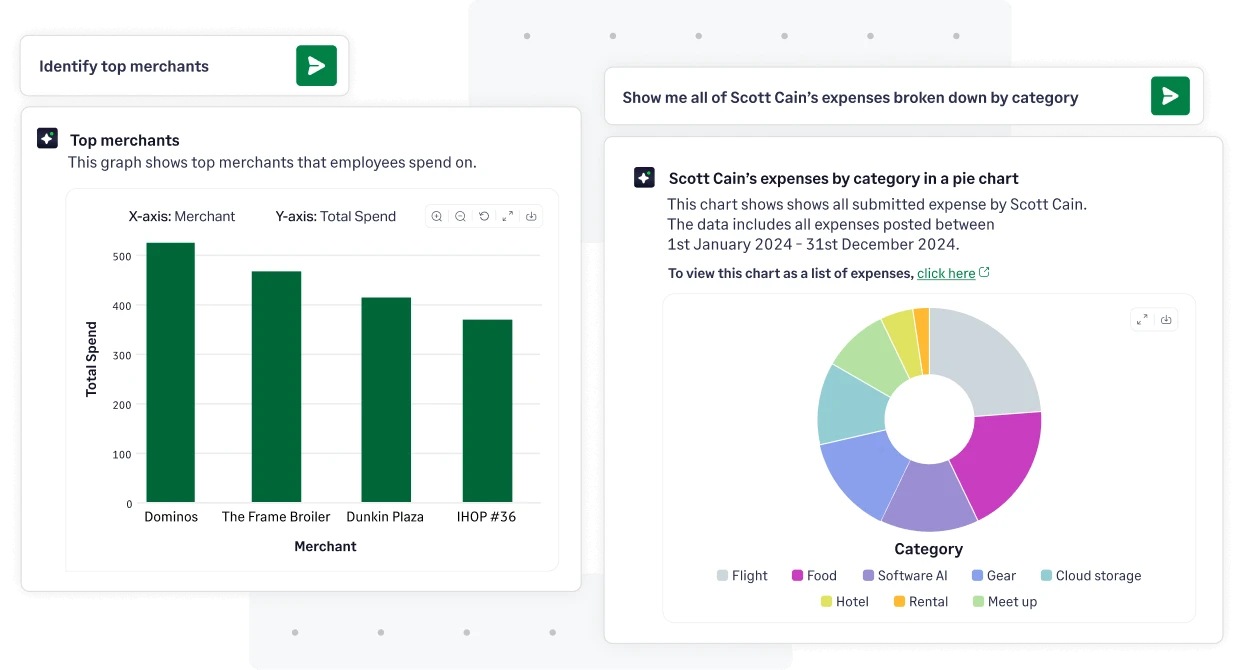
Sage Expense Management's CoPilot delivers instant, AI-driven insights into spending patterns by category, department, or project. These insights are invaluable for crafting the cash flow statement and identifying areas to optimize operational efficiency.
4. Policy Compliance and Fraud Detection
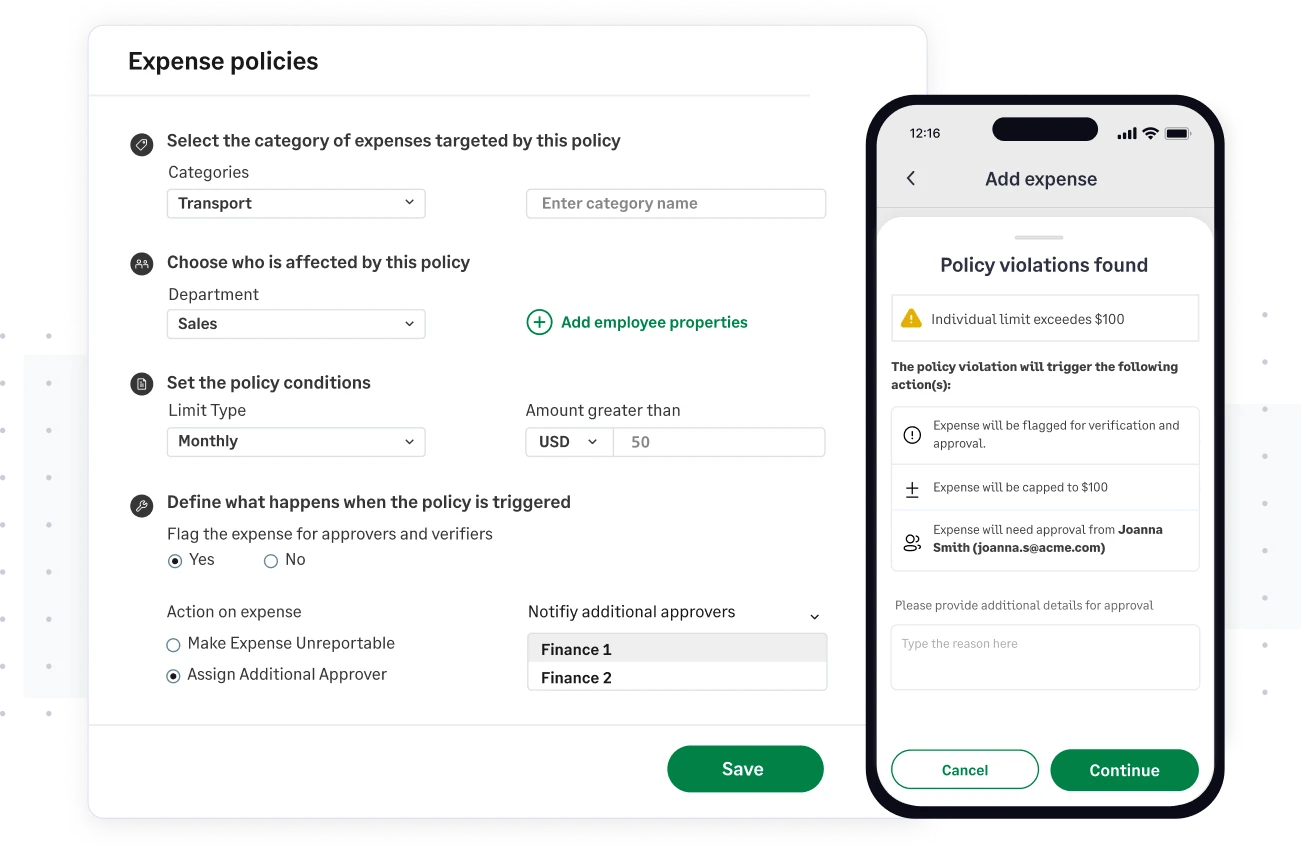
With built-in compliance checks and automated fraud detection, Sage Expense Management helps ensure that all expenses adhere to company policies. This makes it easier to produce accurate and trustworthy reports while avoiding costly errors or oversights.
5. Integration with Accounting Software
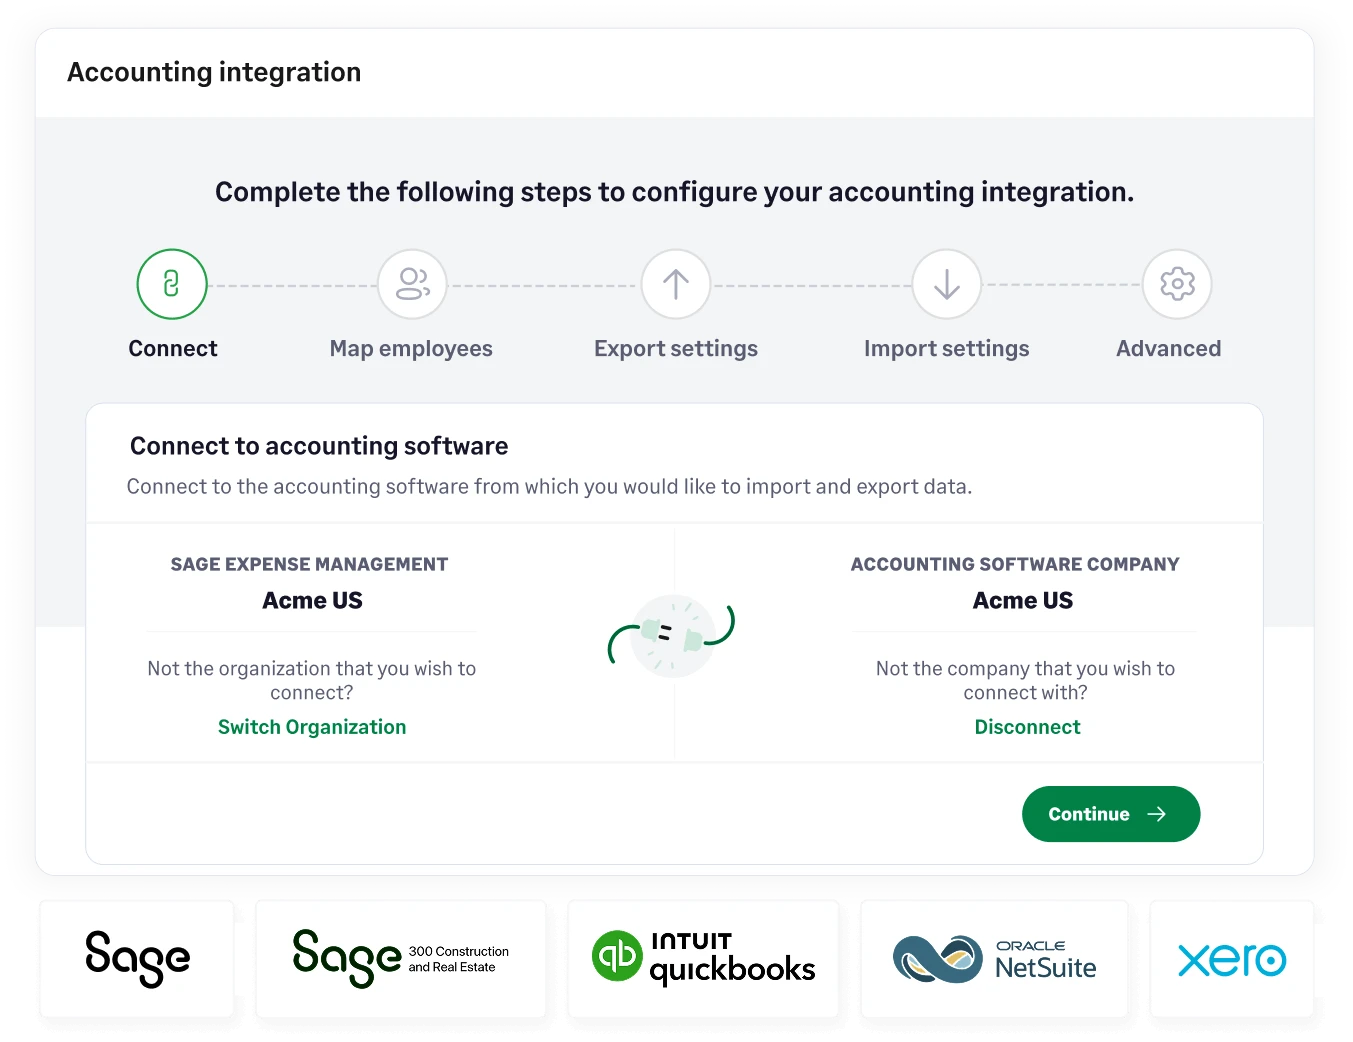
Sage Expense Management integrates seamlessly with popular accounting platforms like QuickBooks, Xero, and Sage Intacct. This enables automatic data synchronization, reducing manual effort and enhancing the accuracy of financial records.
6. Efficient Budget Management
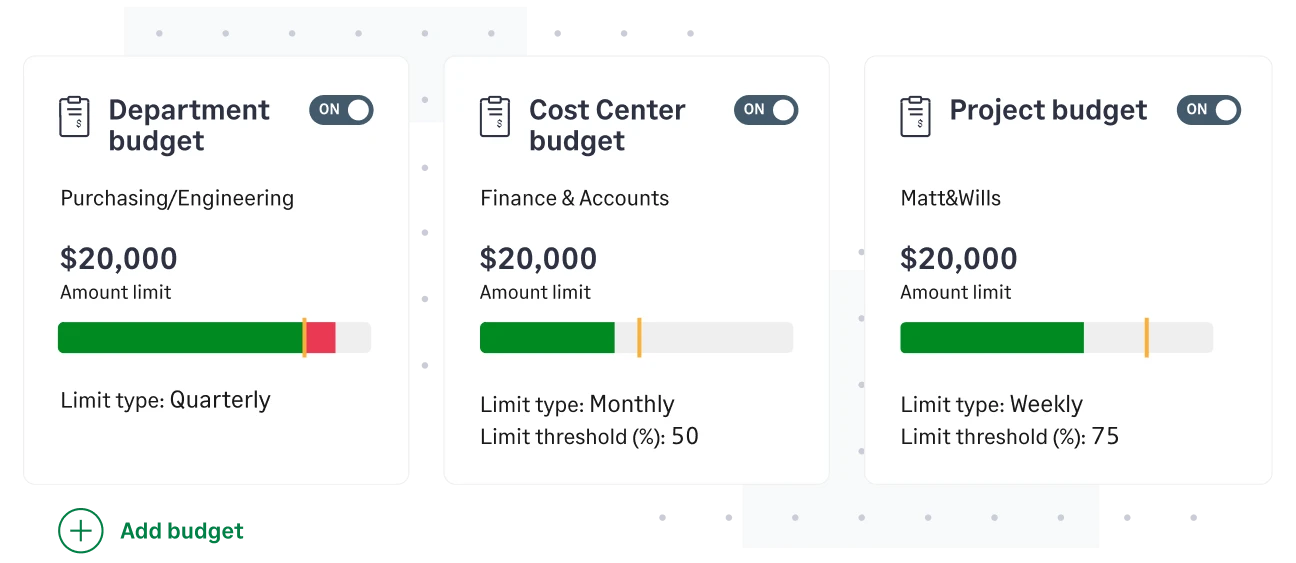
Sage Expense Management's advanced tools for tracking budgets and project spends empower businesses to allocate resources effectively, a crucial component of financial planning and analysis.
By streamlining expense management and providing actionable insights, Sage Expense Management enables businesses to create financial analysis reports that are both accurate and impactful.
In Conclusion
By now, you should understand the value of a company financial analysis report and how to write one. Not only does it show you the financial health status of a company, but it's also the smoking gun investors look for before investing in any business.
To any organization, a financial analysis report is a compass to optimize operational efficiency for growth. With tools like Sage Expense Management, you can streamline expense tracking and ensure accurate data for creating impactful reports.
Summarising, to write a financial analysis report, you need to:
Write your company overview, sales forecast, and other essential sections. Once those are out of the way, you can perform company valuation and risk analysis. Then, all that's left is to summarize what was discussed.
Good luck!
{{expense-reporting="/cta-banners"}}