


In today’s fast-paced business world, keeping track of your company’s expenses is crucial. Not only does it help in understanding where the money is going, but it also enables better financial planning, budgeting, and overall decision-making.
This is where expense analysis comes into play. Whether you run a small business or a large organization, knowing how to effectively analyze your business expenses can save you time, money, and resources.
What Is Expense Analysis?
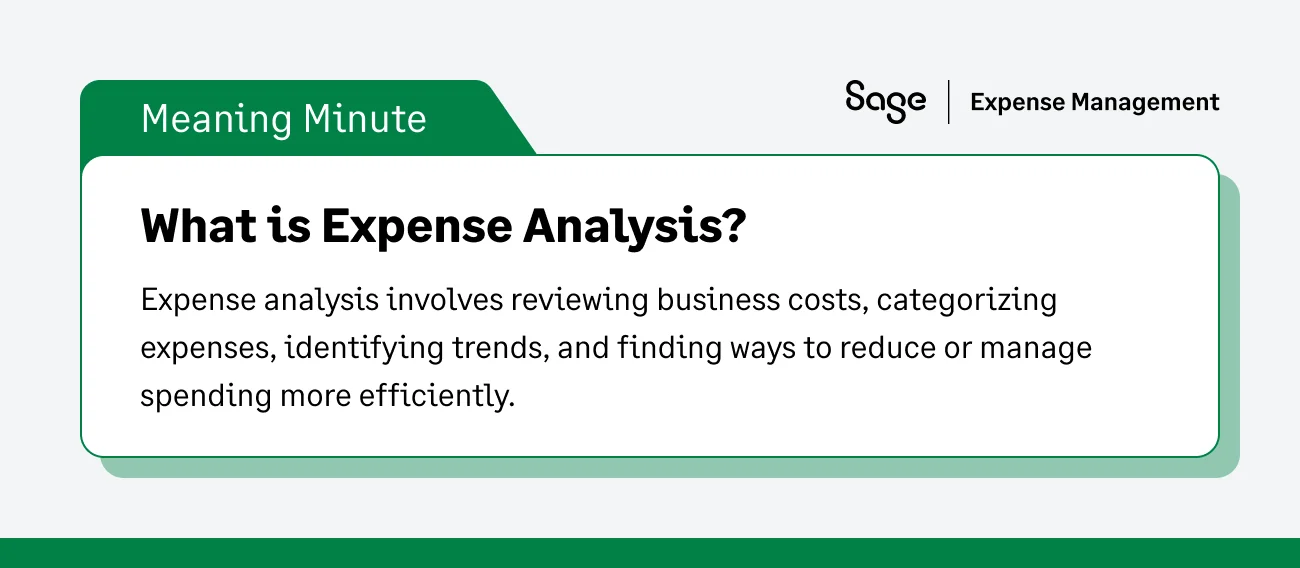
Expense analysis is the process of reviewing and evaluating the costs incurred by a business over a certain period. It involves breaking down expenses into categories, identifying spending trends, and pinpointing areas where costs can be reduced or better managed.
For instance, imagine you run a small retail store. By conducting an expense analysis, you may find that a large portion of your budget is going toward shipping costs. With that insight, you can explore alternatives like renegotiating shipping contracts or finding more affordable suppliers.
Key components of an expense analysis
Some key components of an expense analysis include:
- Categorization of expenses: Breaking down costs into categories like operational, fixed, and variable expenses.
- Trend analysis: Identifying patterns in spending to help forecast and manage future expenses.
- Comparison with benchmarks: Comparing expenses to industry averages or internal benchmarks to assess if spending is excessive.
In order to get a clearer picture, it is important to also consider:
- Semi-variable costs: These are costs that have both fixed and variable components. Analyzing this cost helps in understanding the true cost of scaling sales operations.
- Discretionary vs. Non-discretionary: Distinguishing between nice-to-have spends (travel upgrades, team lunches) and must-have spends (compliance software, insurance) allow for faster decision-making during budget cuts.
Why Is Expense Analysis Important for Your Business?
Expense analysis helps businesses stay on top of their financial health. By understanding where your money is going, you can make informed decisions about cost-cutting, budgeting, and improving operational efficiency.
The Mid-Year pivot
While year-end expense analysis is standard, waiting until December often means looking at problems in the rear-view mirror. Conducting a mid-year expense analysis (typically in June or July) is a strategic move that allows you to:
- Pivot budgets: Reallocate funds to high-performing departments for Q3 and Q4.
- Stop auto renewals: Identify unused software subscriptions before they auto-renew.
- Negotiate contracts: Spot vendor price hikes early and renegotiate terms while you still have leverage.
Impact on cash flow and profitability
Regular expense analysis ensures that cash flow is stable and profitability is maximized. By pinpointing areas where costs can be reduced, businesses can prevent cash shortages and ensure they have enough working capital to meet their needs.
Risks of not conducting regular expense analysis
Some risks of not conducting regular expense analysis are:
- Overspending in certain areas, leading to unnecessary depletion of resources.
- Missed opportunities for cost-saving measures.
- Cash flow issues that can harm day-to-day operations.
Our conversations with customers almost revealed some other critical risks like:
- Audit liabilities due to irregular expense analysis.
- Failing to analyze expenses in real-time in the construction industry leading to overspending on job sites.
- A significant risk of skipping expense analysis is the accumulation of ghost subscriptions- software licenses that auto-renew monthly on corporate cards but haven't been logged into for 90+ days.
- Without expense analysis, businesses often fail to spot vendor redundancy, such as the marketing team paying for Asana while the sales team pays for Trello, preventing the company from negotiating a bulk enterprise discount.
What Business Expenses Should You Track?
Tracking the right expenses is crucial for accurate analysis. Common categories include:
- Fixed Expenses: Costs that remain constant over time, such as rent, salaries, and insurance.
- Variable Expenses: Necessary costs to keep the business running, including maintenance and office supplies.
- Non-Operating Expenses: These include interest on loans and legal fees, which aren’t directly tied to core business operations.
Which expenses are tax-deductible?
Expenses like office supplies, travel costs, employee benefits, and certain operational expenses can typically be deducted from taxable income, depending on tax regulations.
What to know more about business expenses, tax deductibility, and expense categorization? Check out our article on the ultimate cheat sheet.
How to Analyze Your Business Expenses?
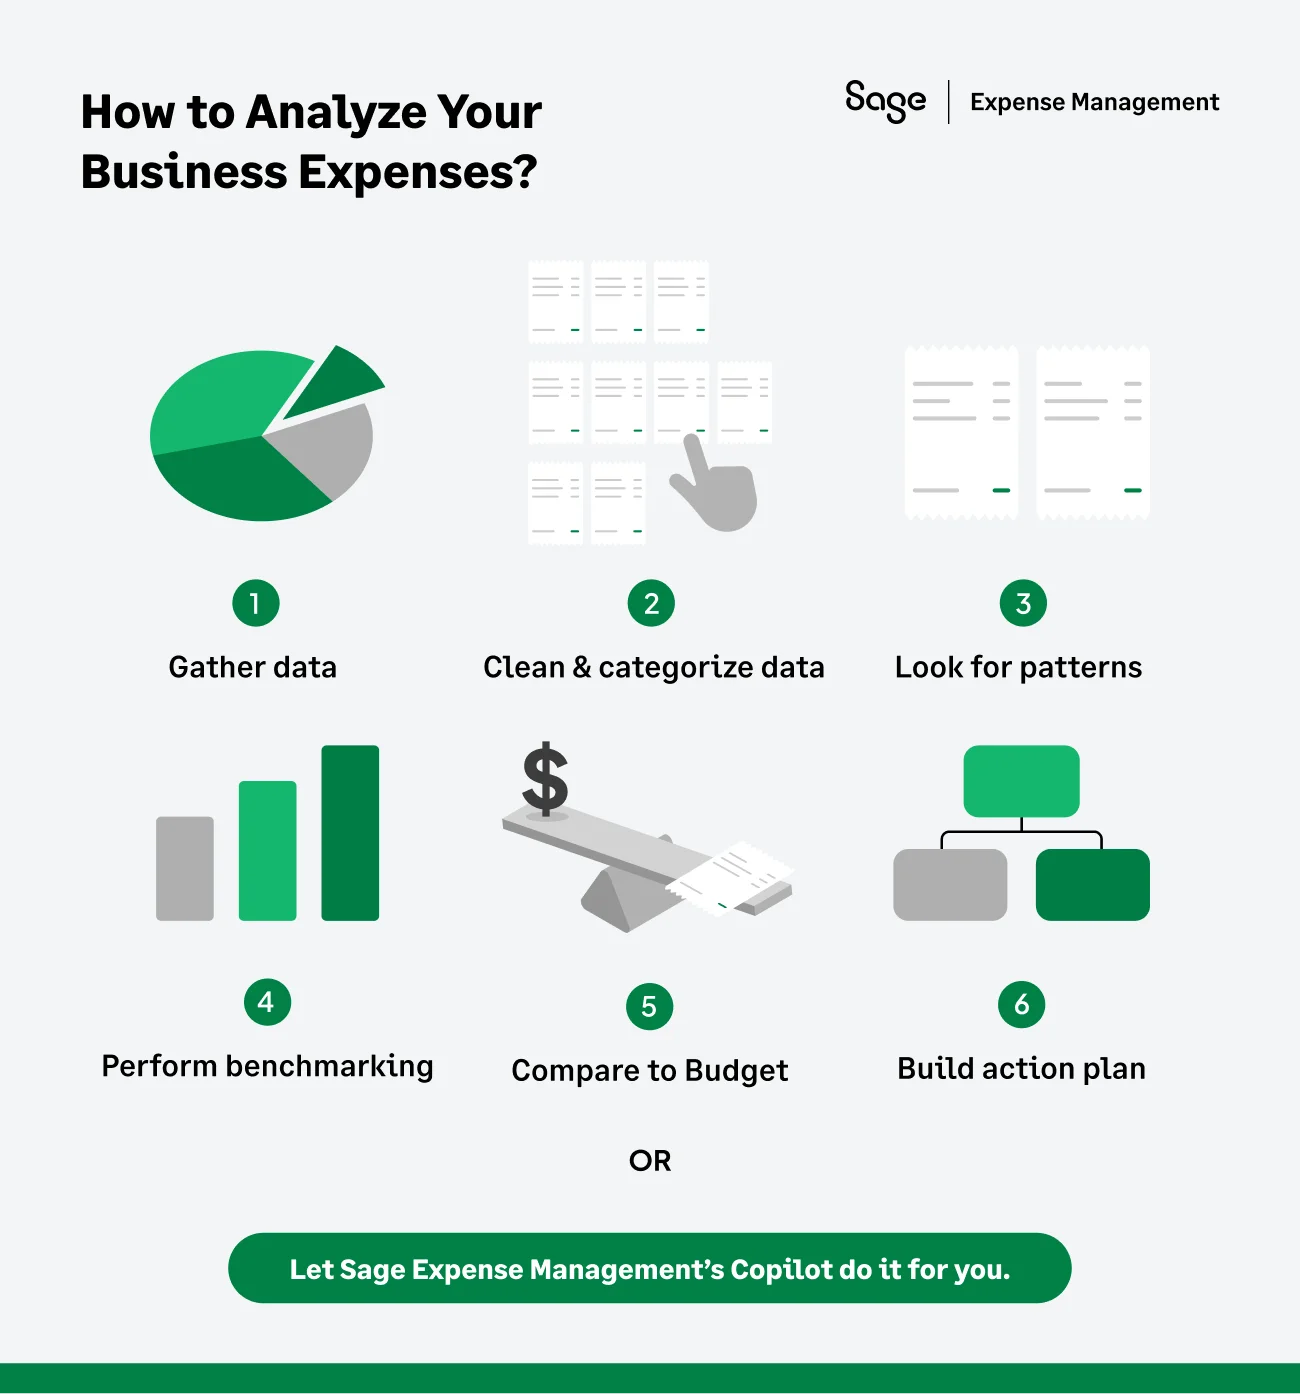
Step 1: Centralize Your Data Streams
You cannot analyze what you cannot see. The first step is to aggregate data from all sources- corporate credit cards, employee reimbursements, bank feeds, and vendor invoices into a single system. If your company relies on scattered spreadsheets or physical receipts, your data will always be incomplete.
Step 2: Clean and Categorize
Raw bank data is often messy (e.g., "AMZN MKTPLACE" vs. "Amazon Web Svcs"). It is important to standardize merchant names and map every transaction to a specific General Ledger (GL) code or category. This ensures that a client lunch is correctly tagged as "Meals & Entertainment" rather than a generic "Miscellaneous" expense.
Step 3: Identify Trends and Seasonality
Once categorized, look at the timeline. Are there spikes in spending that correlate with specific events? For example, seeing a 40% increase in travel costs in Q4 might be standard for your sales cycle, but a similar spike in July might indicate inefficient booking behaviors or lack of oversight.
Step 4: Perform Benchmarking (Internal vs. Industry Standards)
Context is key. Compare your current metrics against your own historical data (Year-over-Year analysis) to spot any anomalies. Then, compare against industry standards. For instance, if your competitors spend 10% of revenue on marketing, but you are spending 25% with similar growth rates, you have an efficiency problem.
Step 5: Conduct Variance Analysis (Actual vs. Budget)
This is the health check of expense analysis. Compare what you planned to spend against what you actually spent. Based on the below legend, you will then be able to make a more informed decision.
- Zero Variance: Perfect planning (very rare).
- Negative Variance: Overspending. This requires an immediate deep dive- was it due to price inflation, volume increase, or waste?
- Positive Variance: Underspending. While usually good, significant underspending might mean critical projects are being delayed.
Step 6: Create an Action Plan
Analysis without action is just trivia. Conclude your review with a decision framework:
- Stop: Eliminate bad costs such as unused software or late fees.
- Start: Allocate funds to high-ROI activities identified during the analysis.
- Continue: Validate and maintain budgets for departments that are performing efficiently.
How to Perform an Expense Analysis On Your Income Statement?
The income statement (or profit and loss statement) is a crucial tool for expense analysis. Here’s how to approach it:
- Revenue vs. Expenses: Start by comparing total revenue to total expenses. Are you spending more than you’re earning?
- Identifying key ratios: Calculate ratios like the expense ratio (total expenses divided by total revenue) to understand what percentage of income is being consumed by expenses.
- Monitor changes: Compare expenses over different periods to highlight trends, such as rising costs in specific areas.
- Implement variance analysis: To go beyond basic expense analysis, compare your actual spend vs. budgeted spend. For example, if your travel budget was $50,000 but actuals are $65,000, you have a negative variance of 30%.
What Metrics Should You Focus On When Analyzing Expenses?
Expense Ratio
The expense ratio shows how much of your revenue is consumed by expenses. A higher expense ratio could signal the need to cut costs or increase revenue.
Expense Ratio = (Total Expenses / Total Revenue) x 100
Cost-per-Unit
Cost-per-unit helps businesses that produce goods assess how efficiently they’re operating. This metric tells you the average cost to produce a single product unit.
Cost Per Unit = Total Production Costs / Number of Units Produced
The ROI of spend formula
For investments in new software or initiatives, you need to justify the expense. Use this formula to calculate the potential return:
ROI = (Net Savings / Cost of Initiative) x 100
Example: If an expense management tool costs $50,000/year but saves you $250,000 in padded mileage and manual labor, your ROI is 500%.
Comparing expenses to industry averages
To determine whether your expenses align with industry standards, compare your expense ratios and cost-per-unit calculations to industry benchmarks.
There’s no specific formula here, but the process involves gathering industry data and calculating your metrics (like the expense ratio and cost-per-unit), then comparing them to those of similar companies. If your expenses are significantly higher, it may signal inefficiencies or missed cost-saving opportunities.
How Does an Expense Analysis Help Businesses?
Expense analysis helps businesses in multiple ways, such as:
- Contributing to better decision-making: By identifying which areas are consuming the most resources, businesses can make informed decisions about where to cut costs or allocate more funds.
- Reduce wasteful spending: Regular analysis can highlight unnecessary or redundant expenses that can be trimmed.
- Improving profitability: By controlling expenses, businesses can increase their profit margins without growing revenue.
How Sage Expense Management's CoPilot Automates Expense Analysis
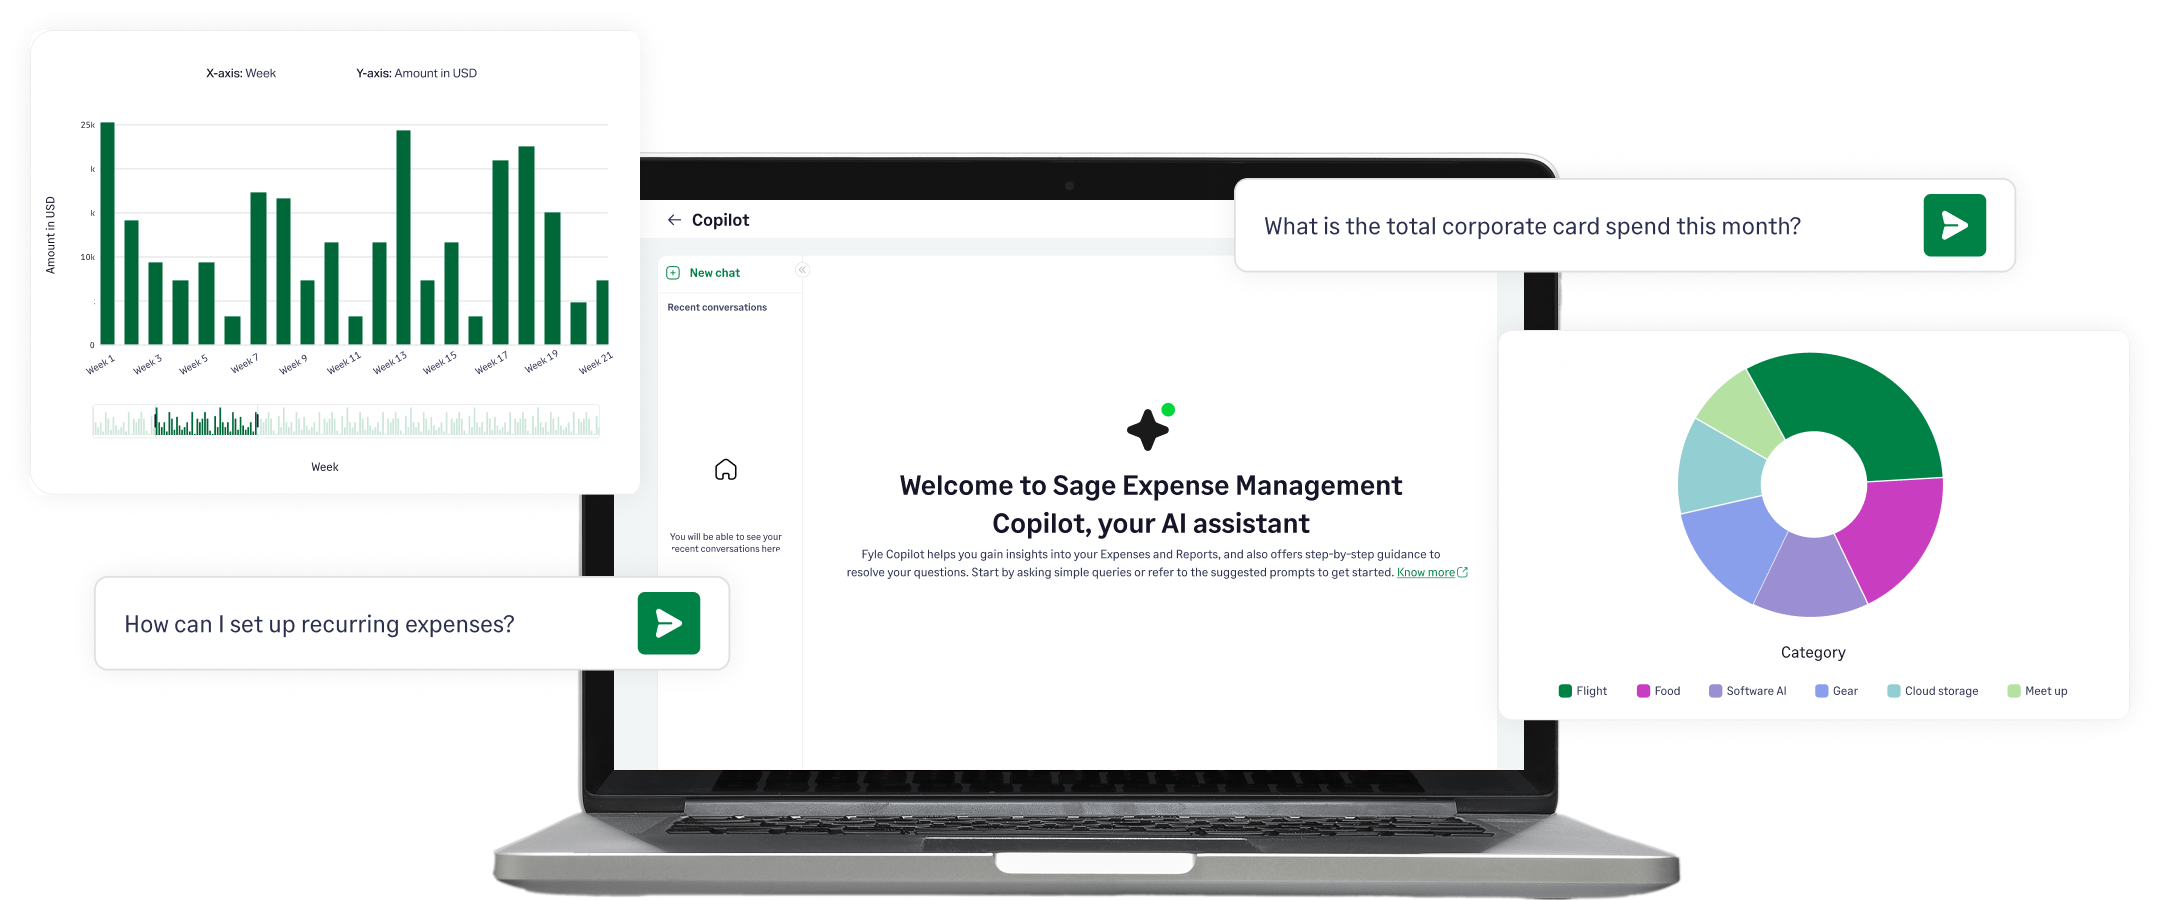
Sage Expense Management offers a powerful, AI-driven solution for businesses looking to automate and optimize their expense analysis process. Here’s how it helps:
Instant AI insights from real-time spend data
It directly integrates with credit card networks like Visa and Mastercard, so CoPilot provides instant analysis of transactions as they are logged, giving you immediate insights.
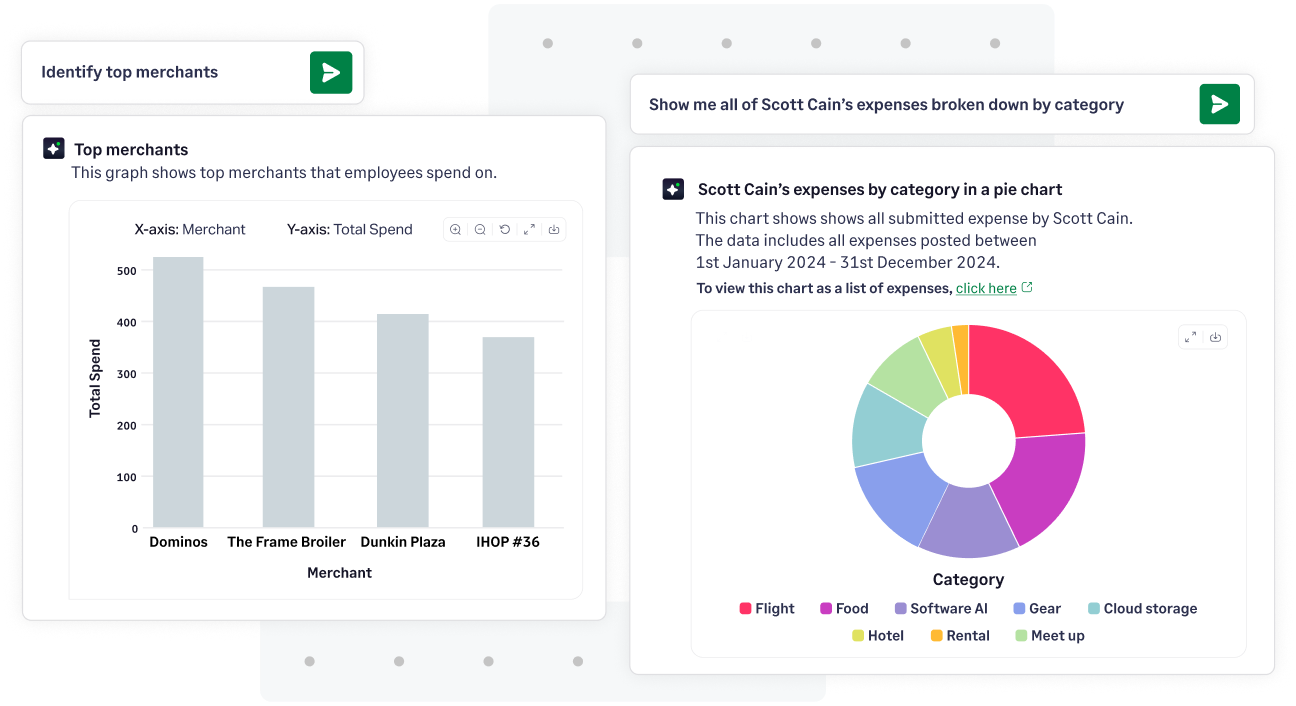
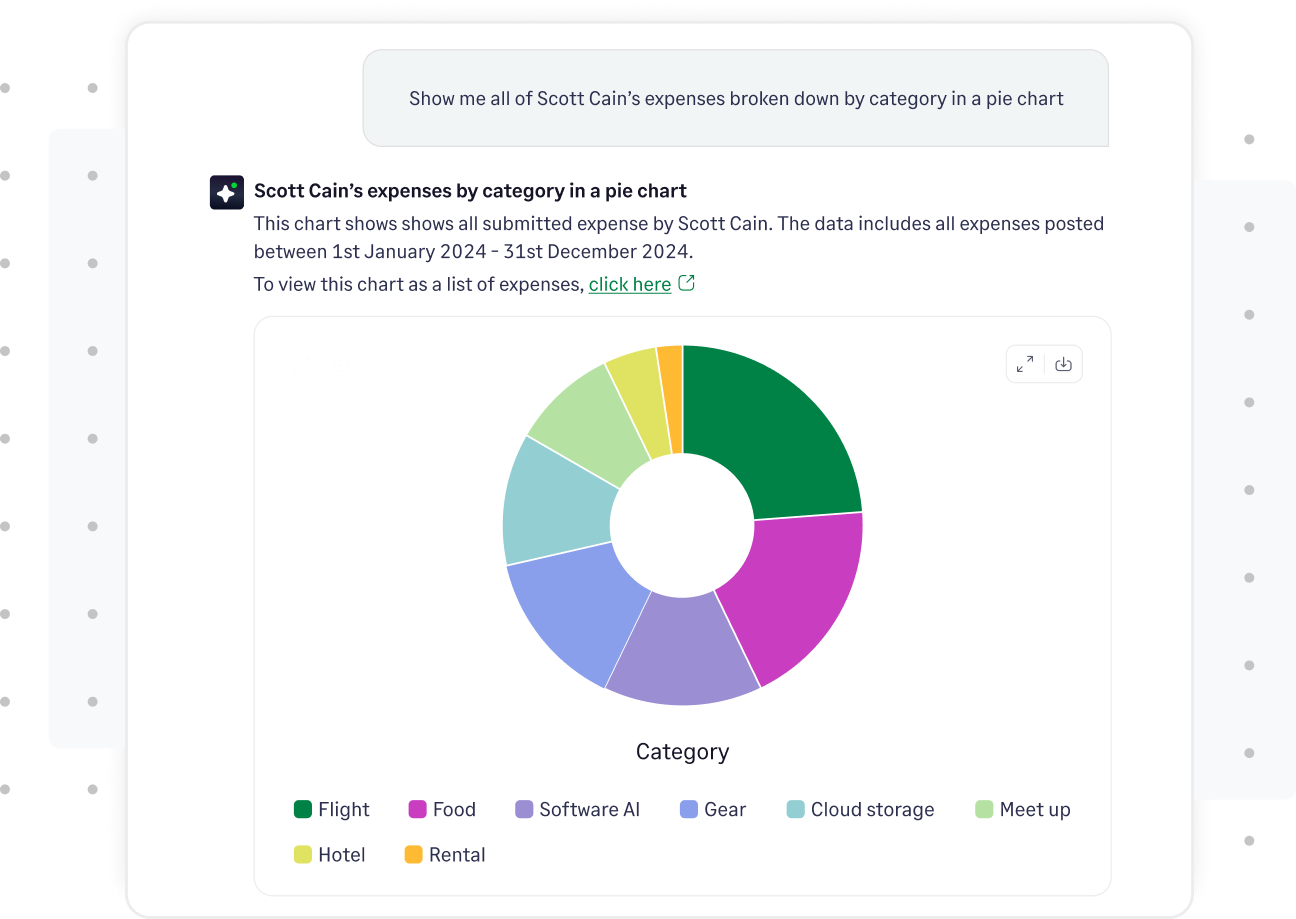
AI-Enhanced detailed spend breakdown
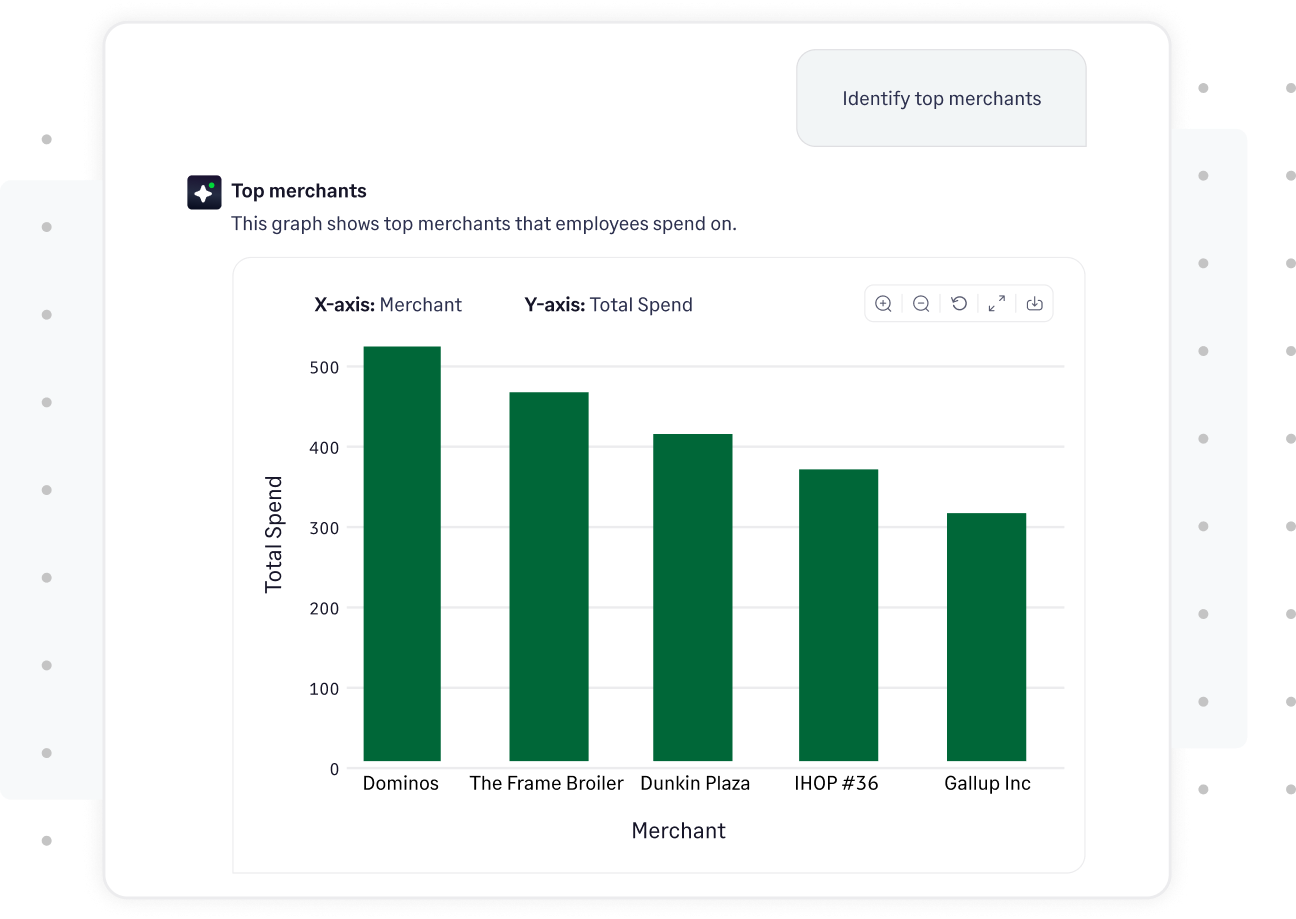
Sage Expense Management CoPilot allows you to analyze expenses based on various factors like merchant, department, and project, using simple conversational queries to see exactly where money is going with AI-driven analysis.
Advanced AI-Powered reporting
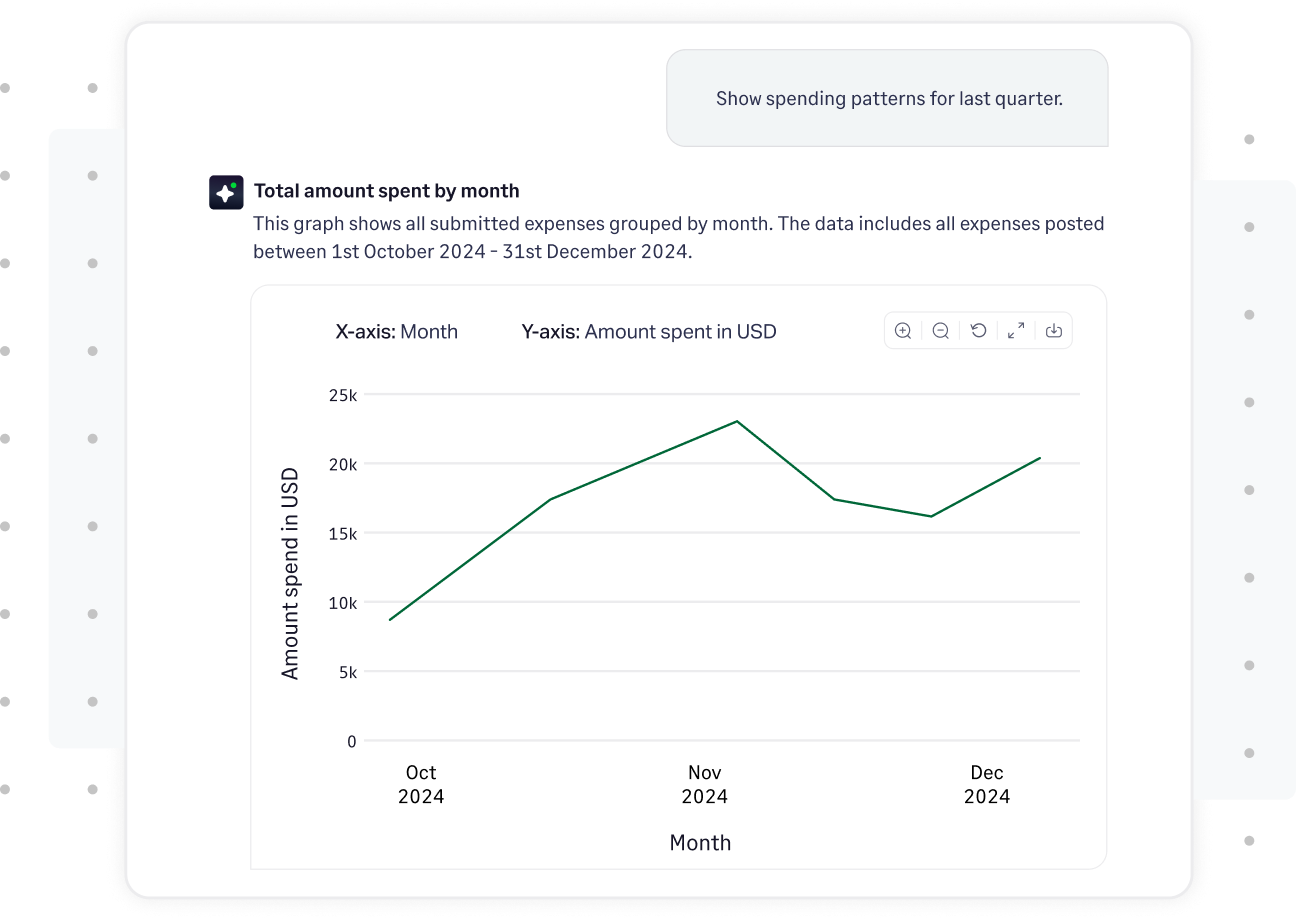
CoPilot goes beyond basic expense analysis, offering intelligent insights to guide your decision-making. Compare spending patterns over different periods, understand which areas are driving up costs, and take action accordingly, all through natural language questions.
AI-Driven risk management
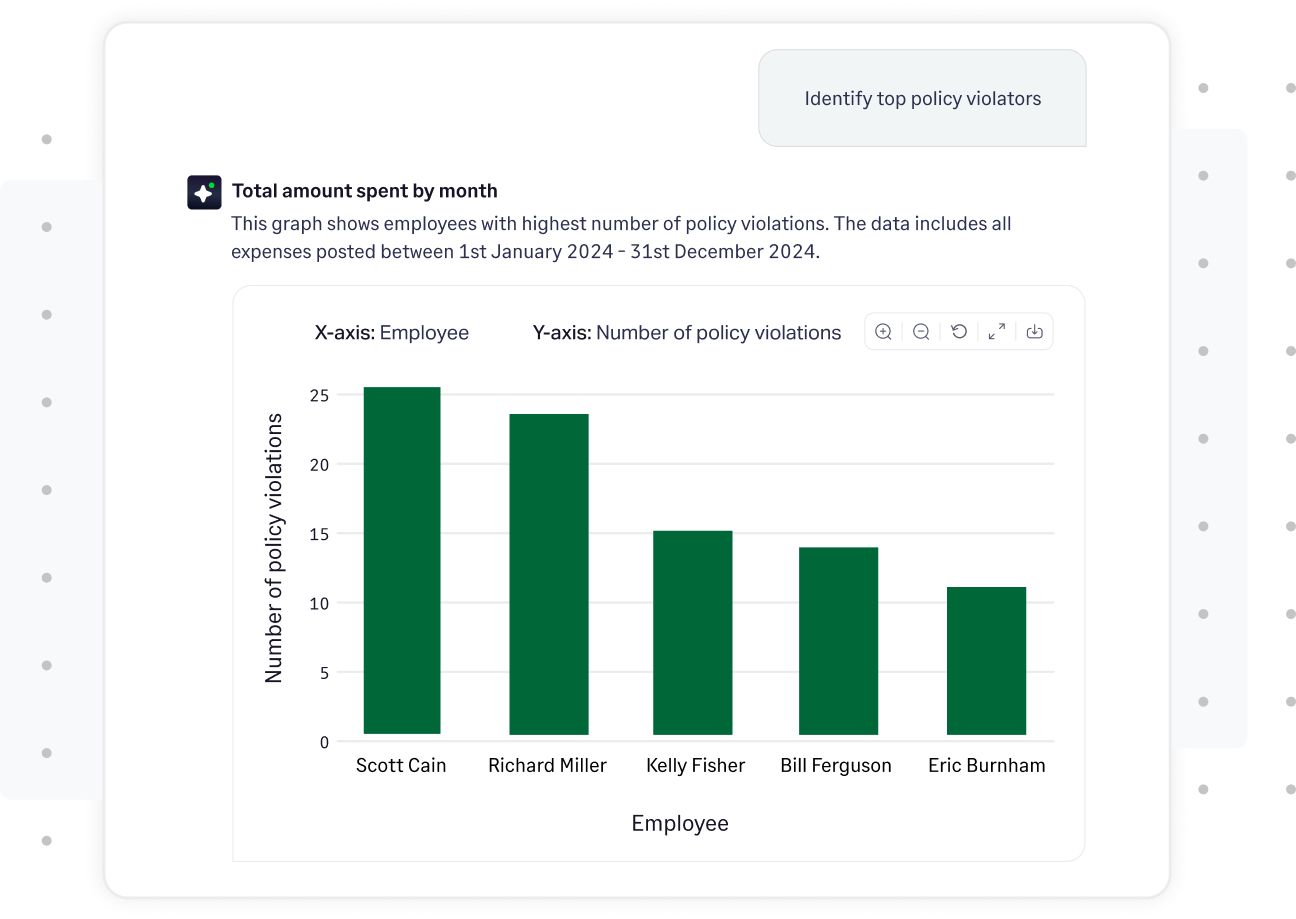
CoPilot helps you stay on top of policy violators and big spenders, flagging violations before they become costly problems with AI-powered alerts and analysis.
AI-Assisted budget control
Real-time budget data allows you to track spending against allocated budgets, helping you forecast and maintain control over expenses with intelligent insights and recommendations from CoPilot.
Expense analysis is a crucial practice for any business looking to manage its finances effectively. By regularly reviewing and optimizing your expenses, you can gain better control over your cash flow, make informed decisions, and improve overall profitability.
With tools like Sage Expense Management, automating and simplifying this process is easier than ever, allowing you to focus on what really matters: growing your business.
{{exp-analysis="/cta-banners"}}
.jpg)